Struggling with Excel to Analyze Data?
5 Strategies For Improving Your Analytics
There’s no doubt that Excel has been one of the tools of choice for analysis and reporting. Users love the control they have, the rapid and easy creation of models and graphics, and the ability to be both independent and self-reliant. With Excel, you’re in the driver’s seat. But just like driving a sports car when what you need is an SUV, using Excel for analysis means that you’re over-served in some ways and in others, much underserved. Out-of-date data (and no easy way to update), error-prone analytics, multiple versions of the same file circulating among colleagues,
too much manual involvement—these are just a few of the frustrations commonly associated with Excel. And what
of the time wasted developing your analysis instead of spending time actually analyzing?
Despite these issues, many departments—and entire businesses—run on Excel, swearing by it one minute
and swearing at it the next. There are better ways, from simple improvements you can make yourself to large
scale, enterprise-oriented changes. This paper focuses primarily on improvements you can make to improve
how you conduct your analytics without sacrificing the advantages of Excel.
Eliminate non-essential analyses
You can improve the quality of all of your analytics if you stop doing so many reports and presentations and just focus on the ones you and your colleagues need to make decisions. Inventory the various analytic reports you and your team maintain and then uncover which ones matter and how often they require updating. You’ll have a much better idea of the metrics that matter and the value that’s being provided to the team. As a bonus, not only will you reduce your team’s workload and focus on the most important tasks but you’ll probably also eliminate a lot of previously unidentified duplicated efforts.

Be smarter about how you use Excel
We’re all so busy doing the same thing over and over that sometimes we forget to stop and ask, “Is there a slightly better way?” And, unless you’re a super power user, when it comes to Excel, there probably is.
- Use the online help! Excel has some great examples. But don’t just read them. Do them. Create a spreadsheet with the same data Microsoft shows in its help and replicate the help files. Doing will help you more than reading.
- Look for help. For the vast majority of data problems you have, there is probably someone with the exact same problem who has described the answer somewhere on the Internet. Search for “pivot tables”, “Excel add ins”, etc. You’ll be amazed at how much there is out there.
- Learn the “analysis essentials.” Tasks and features like “lookup” functions, pivot-tables, the date functions, find/replace, subtotals, named ranges and keyboard shortcuts can help speed your analysis.
- Evaluate yourself and your team for the right technical fit. For example, you may be able to use the “ODBC” driver (Open Database Connectivity standard) to connect to data warehouses and centralized databases. This can be effective but the requirements are steep: 1) you must have access; 2) you must know what you’re looking at and 3) you need to be connecting to or pulling fewer than 1 million rows (for Excel 2010). So don’t expect your analysts to turn into Excel macro experts or database programmers. If you need that kind of help, look to add those skills via part-time contractors or developers.
Be obsessive about the details
The data challenge today isn’t that people don’t have the information. It’s the way they get at it, cleanse it and ensure its integrity. Because everyone does these tasks differently, there are often multiple “versions of the truth.” Excel only makes this worse. When you add in the logical errors made in spreadsheets, we’re talking about a lot of potential incorrect or misleading information. In fact, there are industry estimates that 90% of spreadsheets contain data or logical errors. Quality checking and clear communication are crucial.
Obviously, no one’s perfect so never assume you cleansed your data, wrote your formula or sorted your data right every time. Do a lot of quality checking along the way. You have to provide accurate data, and you must go out of your way to explain where you got it, how it was calculated and why it might differ from the reports they’ve been seeing.
Be careful and descriptive about naming, including column names, file names and version numbers. Good, clear documentation would be ideal. More attentiveness to naming and documentation is not going to stop the problems but it may reduce them.
Don’t overestimate what other people know about using Excel. For example, Excel does have some file management and change tracking capabilities. Do you know what percent of people know how to use and comply with them? It’s not many. You can decide you want to be the one to educate the world or you can decide to do things in very clear, simple ways so that you get back the input you need.
Work your internal resources for better data
Now is as good a time as any to start talking to your colleagues about your data needs and what you’re doing with Excel. By showing and sharing about your current analytics, you’ll get good ideas and start setting the stage for more sophisticated and systematic approaches.
The data challenge today isn’t that people don’t have the information. It’s the way they get at it, cleanse it and ensure its integrity. Because everyone does these tasks differently, there are often multiple “versions of the truth.”
Make time to start talks with the leaders of your IT department. Although many IT executives are busy with security and governance issues, they too would rather provide you a more useful, secure approach than running the many report requests which they know will end up in hundreds of Excel files spread across the company. (A major concern for some IT groups is the control and potential elimination of these so-called “spreadmarts” (a TDWI-coined term describing the proliferation of Excel files within an organization). While it would be naïve to say that your team and your IT department can easily align goals and resources, you can start to talk about ways to improve operations.
Some organizations already have complex and underutilized business intelligence platforms available. Much of the work associated with these BI systems may be reusable. (The assumption is that your BI systems are not delivering a high degree of usefulness; otherwise, you’d already be using them and not Excel).

Have a plan for upgrading your analytic efforts to tools more appropriate for the job. Be realistic about Excel’s limitations.
There’s an old saying: when all you’ve got is a hammer, everything looks like a nail. This applies to analytics and Excel. Business users often don’t have other, more appropriate tools and we frequently can’t get the attention we need from IT. So we end up spending far too much time and effort trying to make Excel work when it just isn’t the right application.
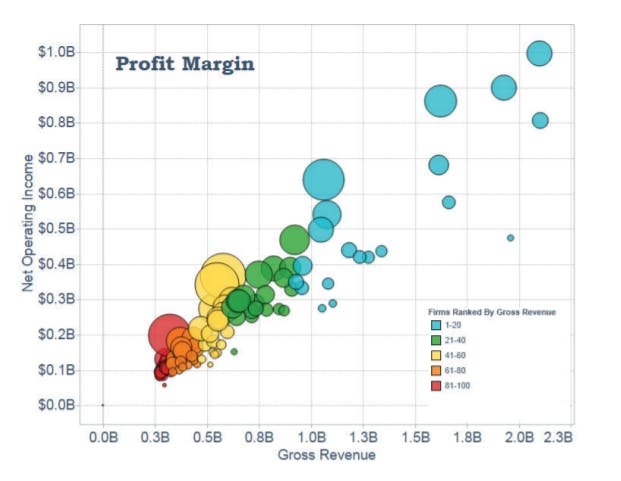
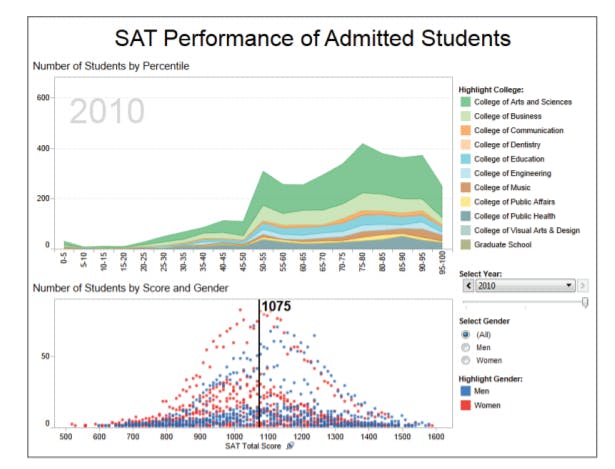
So look around. There are tools out there. Ideally, your analytics would rely on software that is as easy to use as Excel but that connects directly to your source data. As an example, Tableau Software (full disclosure— Tableau is the sponsor of this paper) makes applications for fast analytics and visualization that connect to existing Excel spreadsheets, data warehouses and other data sources. The software combines data exploration and graphic visualization in an easy-to-use, highly intuitive application.
The goal is to help people ask rapid questions of their data and get immediate, real-time answers. Customers have described it as “Excel on steroids.” Bill Attridge of HTM Corporation said “People using Excel PivotTables for analysis take note. If you use Tableau once, you’ll never use an Excel PivotTable again. Tableau is great for analysis and even makes the work fun.”
In the end…
Some users will never stop swearing by and simultaneously swearing at Excel. Analytic habits don’t change overnight. It’s natural to want to use Excel as a flexible, low-cost method for analytics but we must recognize its limitations. If you genuinely seek to reduce the number of analytic reports, learn some new Excel tricks, pay obsessive attention to quality, collaborate with your IT department and seek out more robust new solutions, you will build a stronger, more flexible analytic environment that will serve your needs well into the future.
